-
Overview
-
Sequence Input
-
Database Search
-
Multiple Alignment
-
Key Annotation
-
Structure Input
-
Paired
-
Tools
-
Miscellaneous
-
Statistics
-
Licence File
Summary
This tab gives an overview of annotation available for the query sequence.
Global Viewing Options
Selection boxes are included at the top-right of the page to customize the display as follows
- Colour selection - Including abYsis residue frequencies
- Numbering scheme
- CDR region definition
- Organism - To control residue frequency data
When selected, the options will be applied to all tabs until a different selection is made.
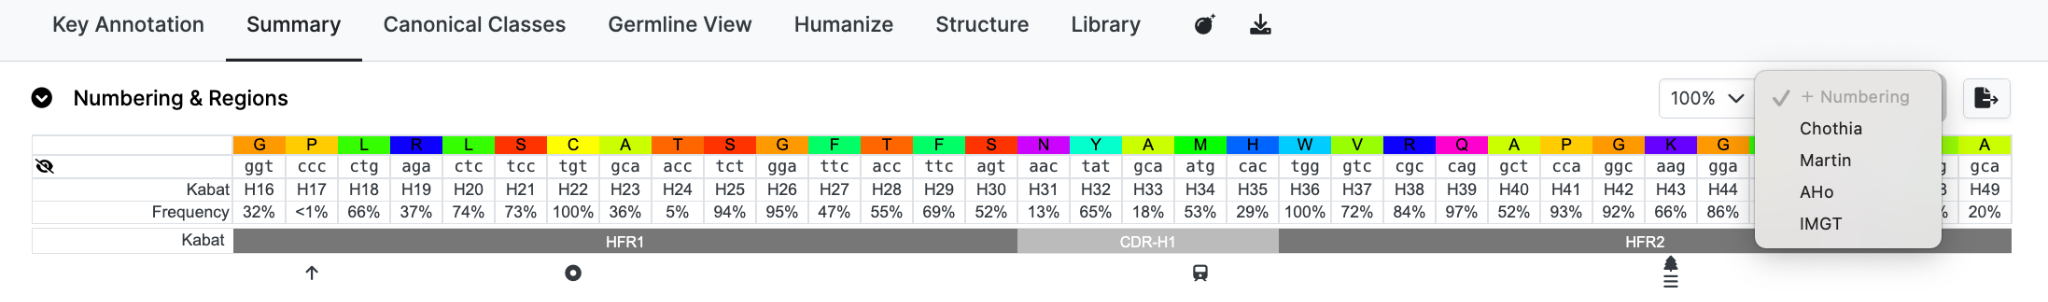
It is possible to display additional numbering schemes simultaneously using the +Numbering
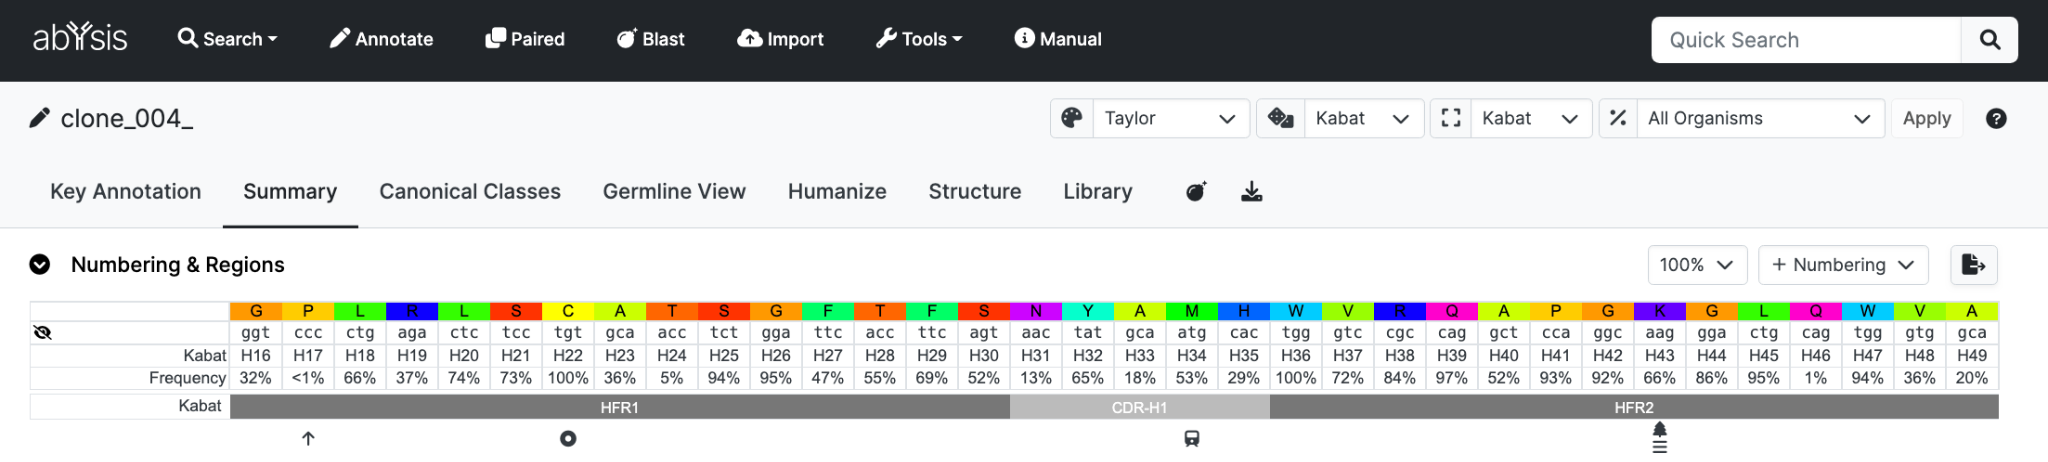
Numbering & Regions
If the query sequence has been numbered, residue numbers and regions are displayed.
However only the numbered section of a sequence is displayed.
In the display you will see the following;
Row 1: Amino acid residues of the sequence of interest.
Row 2: DNA codons if available.
Row 3: Primary numbering - in the top figure this is Kabat.
Row 4: Frequencies of each residue at that position.
Row 5: CDR definitions - in this example Kabat. CDR (loop) regions in light grey and the framework regions in darker grey.
Row 6: Symbols denoting Post Translational Modifications and other data. Putting your mouse over an icon with provide an explanation of each.
A key is shown below the sequence to indicate the meaning of each symbol.
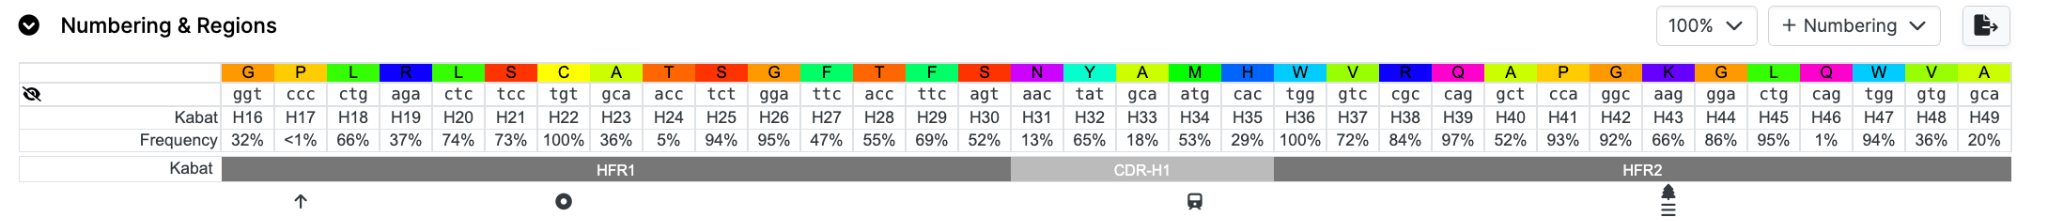
Rows can be hidden by clicking the ‘eye’ icon and brought back using the corresponding icons (or dropdown menus depending on the Tab)
Here we remove the DNA row and a DNA icon appears;

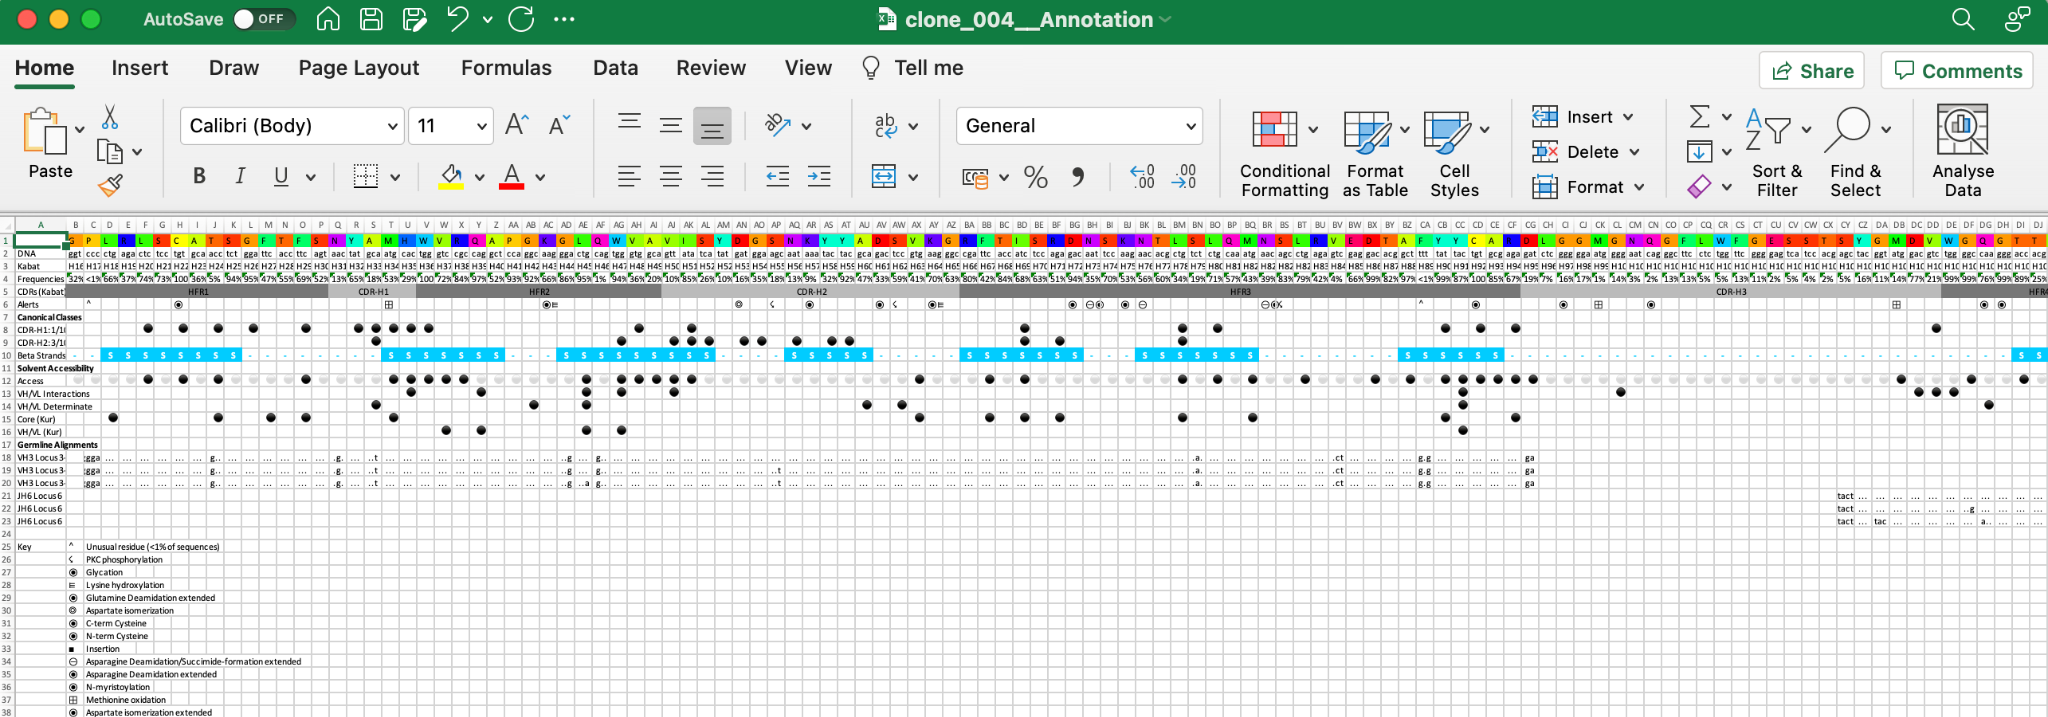
Data can be exported to an Excel spreadsheet (XML format) by clicking the 'Export to Excel button'. This will export data from all Tabs not just the one you are on.
Distribution graph and table
Clicking a residue on the top row changes the histogram to frequencies for that position. Depending on the colour scheme used (not none or frequency) the residue from your sequence will be highlighted in colour.
The residue for that position is coloured according to the colouring system selected, all other residues are grey. This graph is supported by an equivalent table indicating the number of sequences in the database in which given residue orrurs at the selected position, and the relative frequency. Again, the selected residue is coloured accordingly.
Humanness
The 'humanness' of your sequence is shown as a dotted red line.

It is calculated using the method of Abhinandan and Martin (2007) [J. Mol. Biol 369:852-862].
The graph shows a distribution of scores for expressed human sequences and for expressed mouse sequences.
There are four display options: Heavy, Light, Lambda and Kappa, which can be selected if the appropriate view has not already been provided.
The default view is a smoothed graph, but the original data can be viewed by toggling the respective Smoothing button.
In general as sequences become more human-like, the red line will migrate towards the right.
Comparison organism
The sequence data are given for all organisms in the database. However, this can be changed by selecting a different organism in the Comparison Organism list.
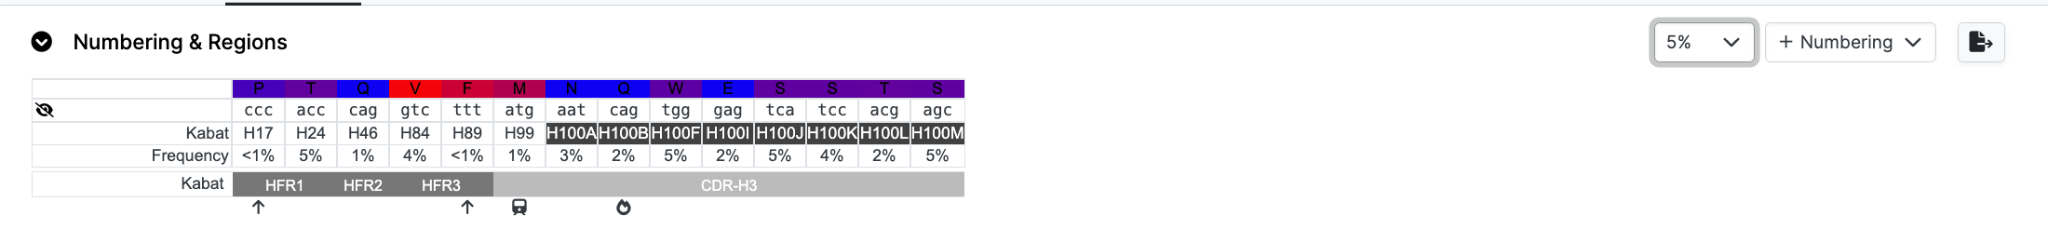
Threshold
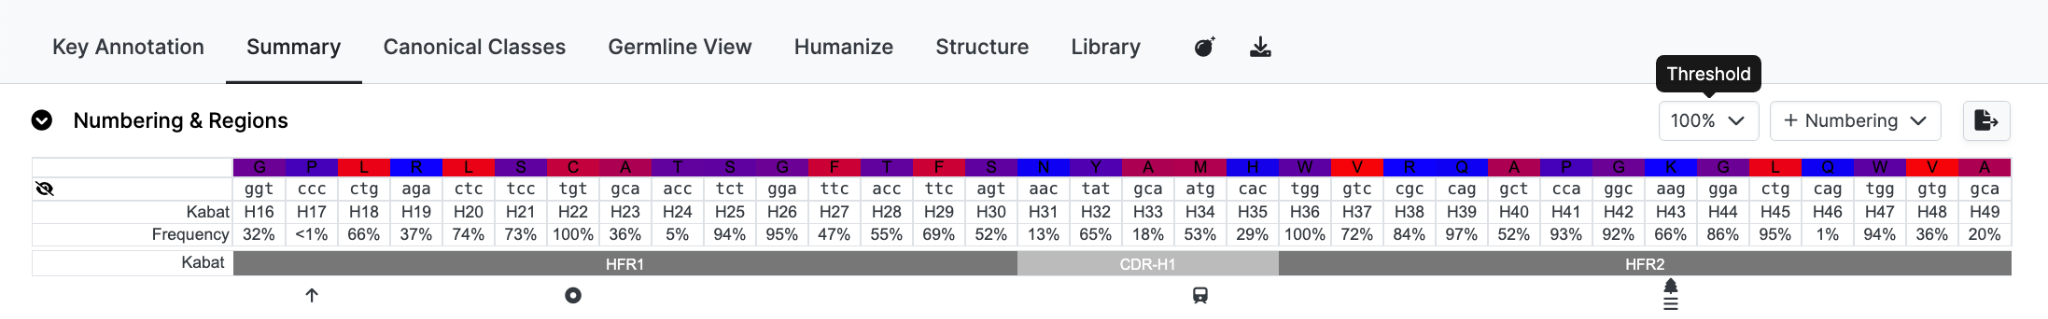 Reduced the residues displayed by selecting a cutoff Threshold for the frequency. For example if you only want to see unusual residues change the selection to e.g. 5%. In this example there are 14 residues with infrequent residues at their positions.
Accessions & Annotations and Sequences
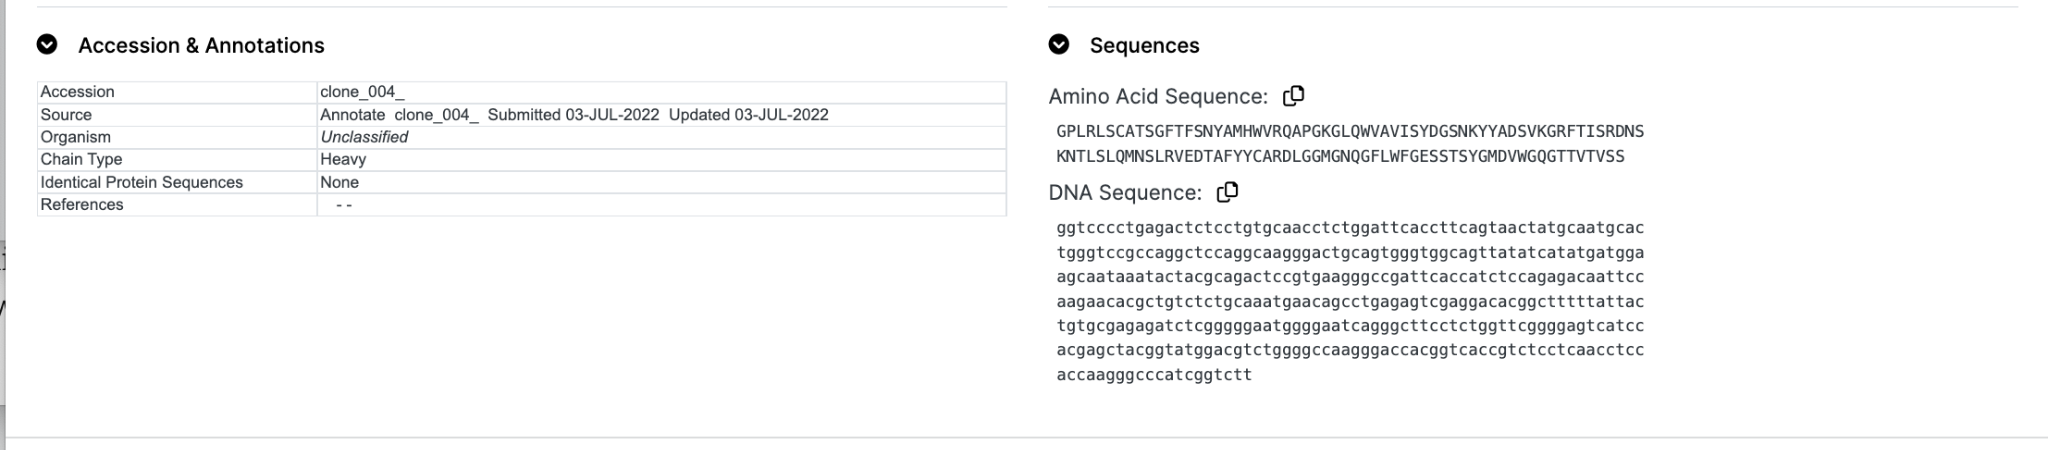
A summary of computed and textual annotations is provided. This includes chain classification, human subgroup assignment (where appropriate), warnings, identical sequences, data provenance and references.
Sequences
The protein and/or DNA sequence will be repeated here in a simple text format that can be cut-and-pasted into other software.
Send to Blast
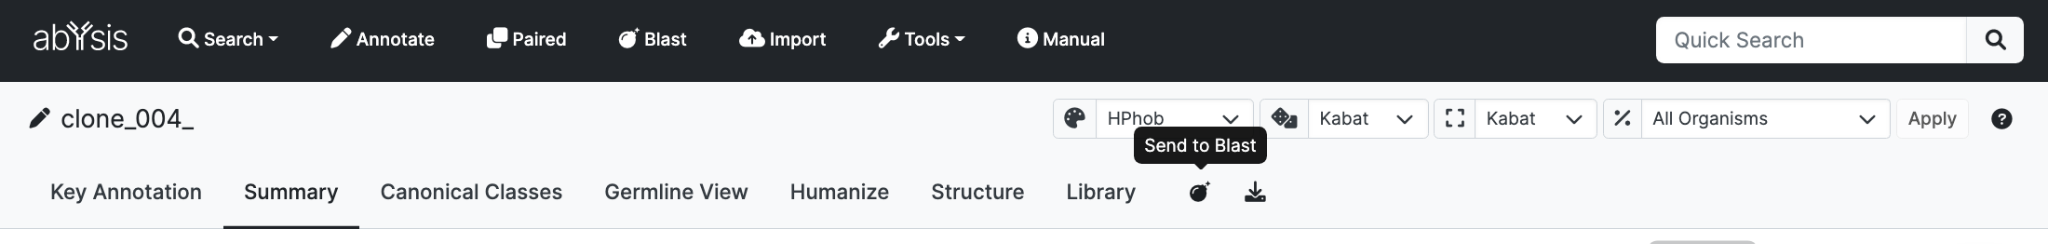
The Blast button transfers the protein and/or DNA sequence into the Blast query page where either sequence can be blasted against various sequence sets in the abYsis database.
If there is a DNA sequence but no protein sequence (for example, if no translation was provided by the Data Source) the Translate & Annotate button will appear. This will transfer the DNA to the Key Annotation Query form where abYsis will attempt to translate and annotate it.