-
Overview
-
Sequence Input
-
Database Search
-
Multiple Alignment
-
Key Annotation
-
Structure Input
-
Paired
-
Tools
-
Miscellaneous
-
Statistics
-
Licence File
Humanness
abYsis calculates the 'humanness' of your sequence using the method of Abhinandan and Martin (2007) [J. Mol. Biol 369:852-862].
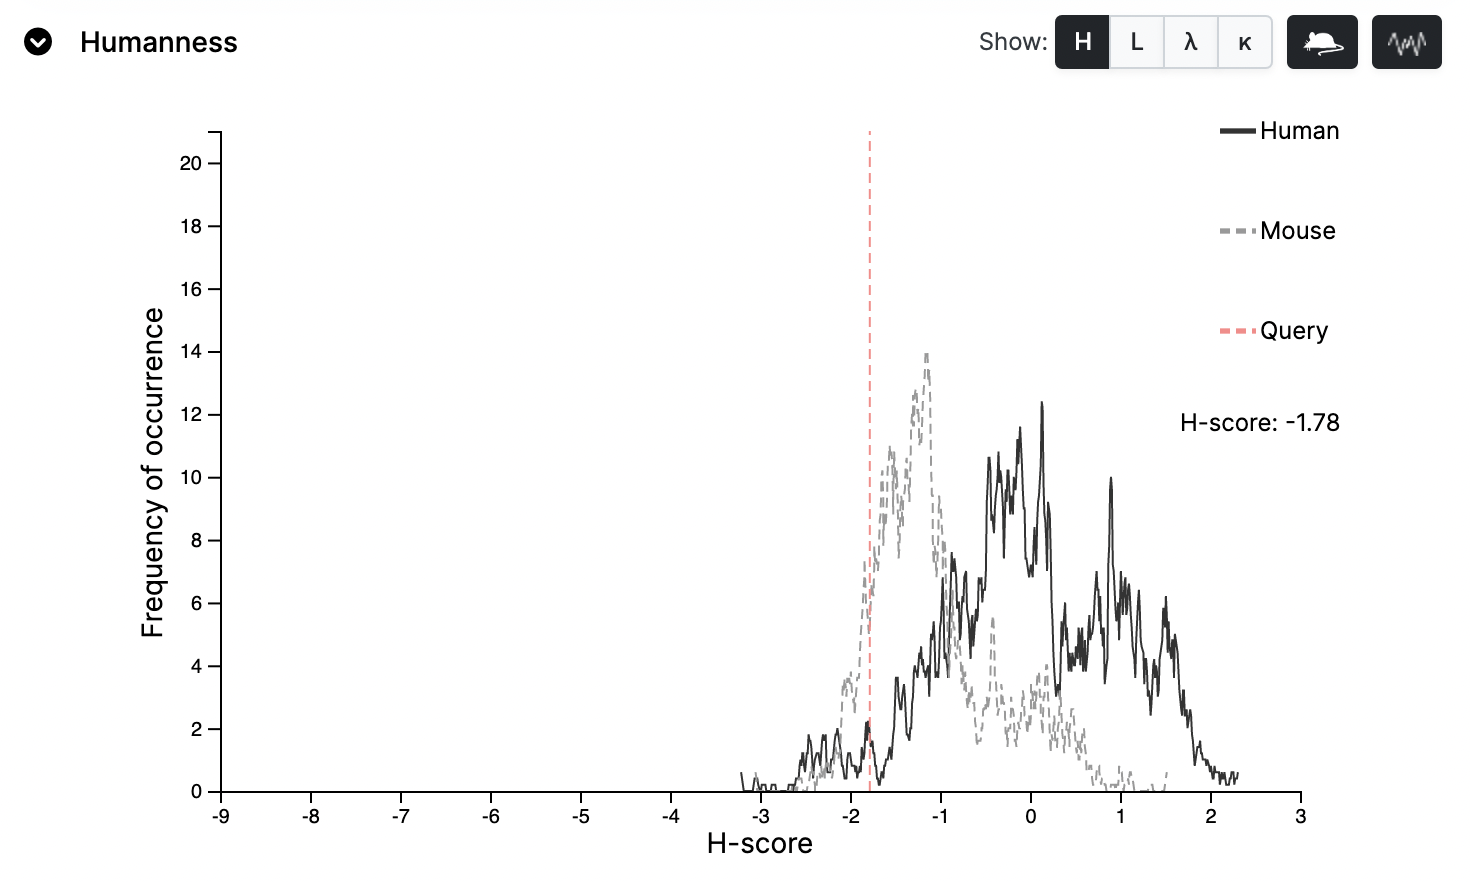
Graphical Display
Shows a distribution of scores for expressed human sequences (solid line) and expressed mouse sequences (dotted line). Your sequence of interest is indicated by the vertical red dotted line.
A score of zero represents a sequence with average humanness - positive scores are more representative of human sequences than average while negative scores are less representative of human sequences than average.
Graph selection: abYsis will try to show the appropriate graph but if not this can be selected.
Controls
You should not normally need to change the options at the top of the graph.
Graph Smoothing is turned on by default but raw data may be displayed
Mouse Distribution checkbox controls whether the graphs show the mouse distribution as well as the human distribution.
Method
In brief, the distributions are created by scanning every human sequence in turn against all other human sequences and calculating the mean sequence identity to other human sequences (the 'raw humanness'). The mean of these raw humanness scores is then calculated and each sequence is then given a final humanness score expressed as a number of standard deviations away from the mean. Mouse sequences are compared against the human library in the same way.
The sequence of interest is also scanned against the library of human sequences and a score calculated in the same way.